Customer Analytics · DataCamp Certification Project
Reducing Subscriber Churn at Fit.ly
A complete analysis joining account, engagement and support data to identify churn drivers and translate them into a measurable action plan.
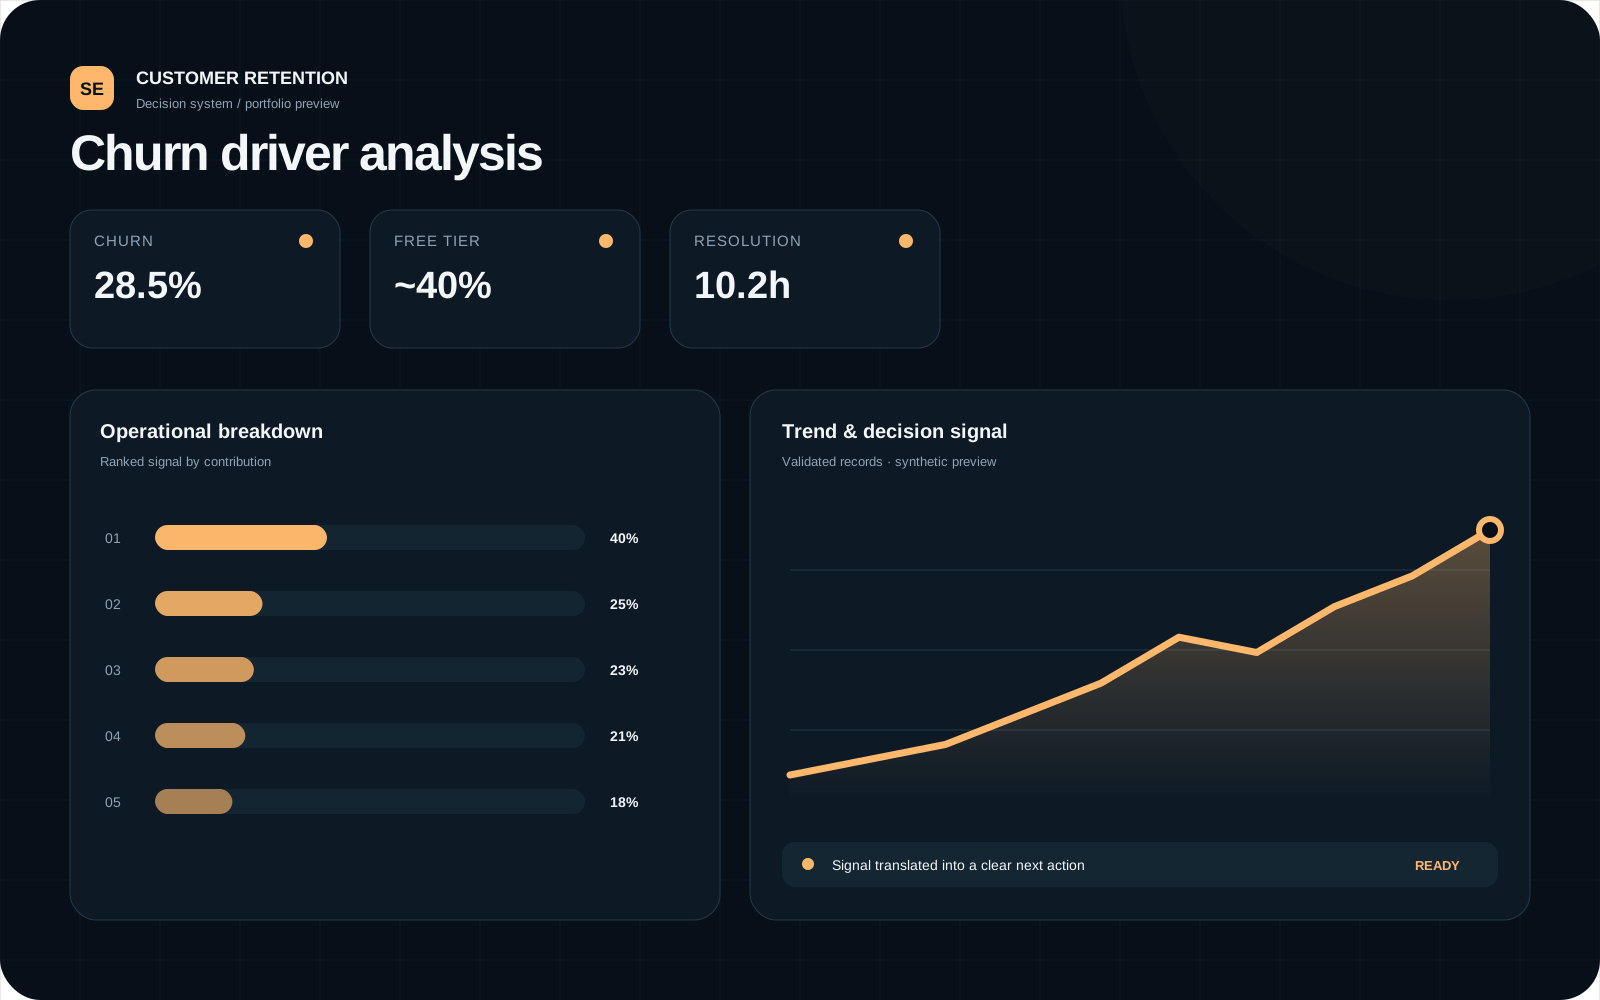
Why this matters
Connected customer behavior and support experience to an executive recommendation: fix resolution time, activate new users and reassess the free tier.
The question
Problem
Leadership saw churn increasing while acquisition costs were rising. The data came from multiple teams with inconsistent fields and had to be reconciled before the drivers could be trusted.
The work
Approach
- 01
Validated account, support and activity sources against the data specification.
- 02
Built a customer-level analytical view across plan, engagement and support behavior.
- 03
Compared churn patterns by tier, usage and issue-resolution experience.
- 04
Converted findings into next-quarter targets and owner-ready actions.
Verified evidence
What the analysis surfaced
Overall churn
Free-tier churn
Paid-tier churn
Resolution for retained users
Resolution for churned users
Current average resolution
The decision
Recommended action
- Reduce average ticket resolution time below eight hours.
- Target overall churn below 20% and monitor it with support-response leading indicators.
- Design first-week activation around at least two meaningful product actions.
- Audit whether the free tier is under-delivering value or attracting the wrong audience.
Capabilities demonstrated
Tools
Limits & responsible use
- The project is a certification case study using a simulated company and supplied dataset.
- Observed relationships are analytical signals, not causal proof without an experiment.