CRM Analytics · R Shiny · Analytics Engineering
Sales Leadership Analytics Platform
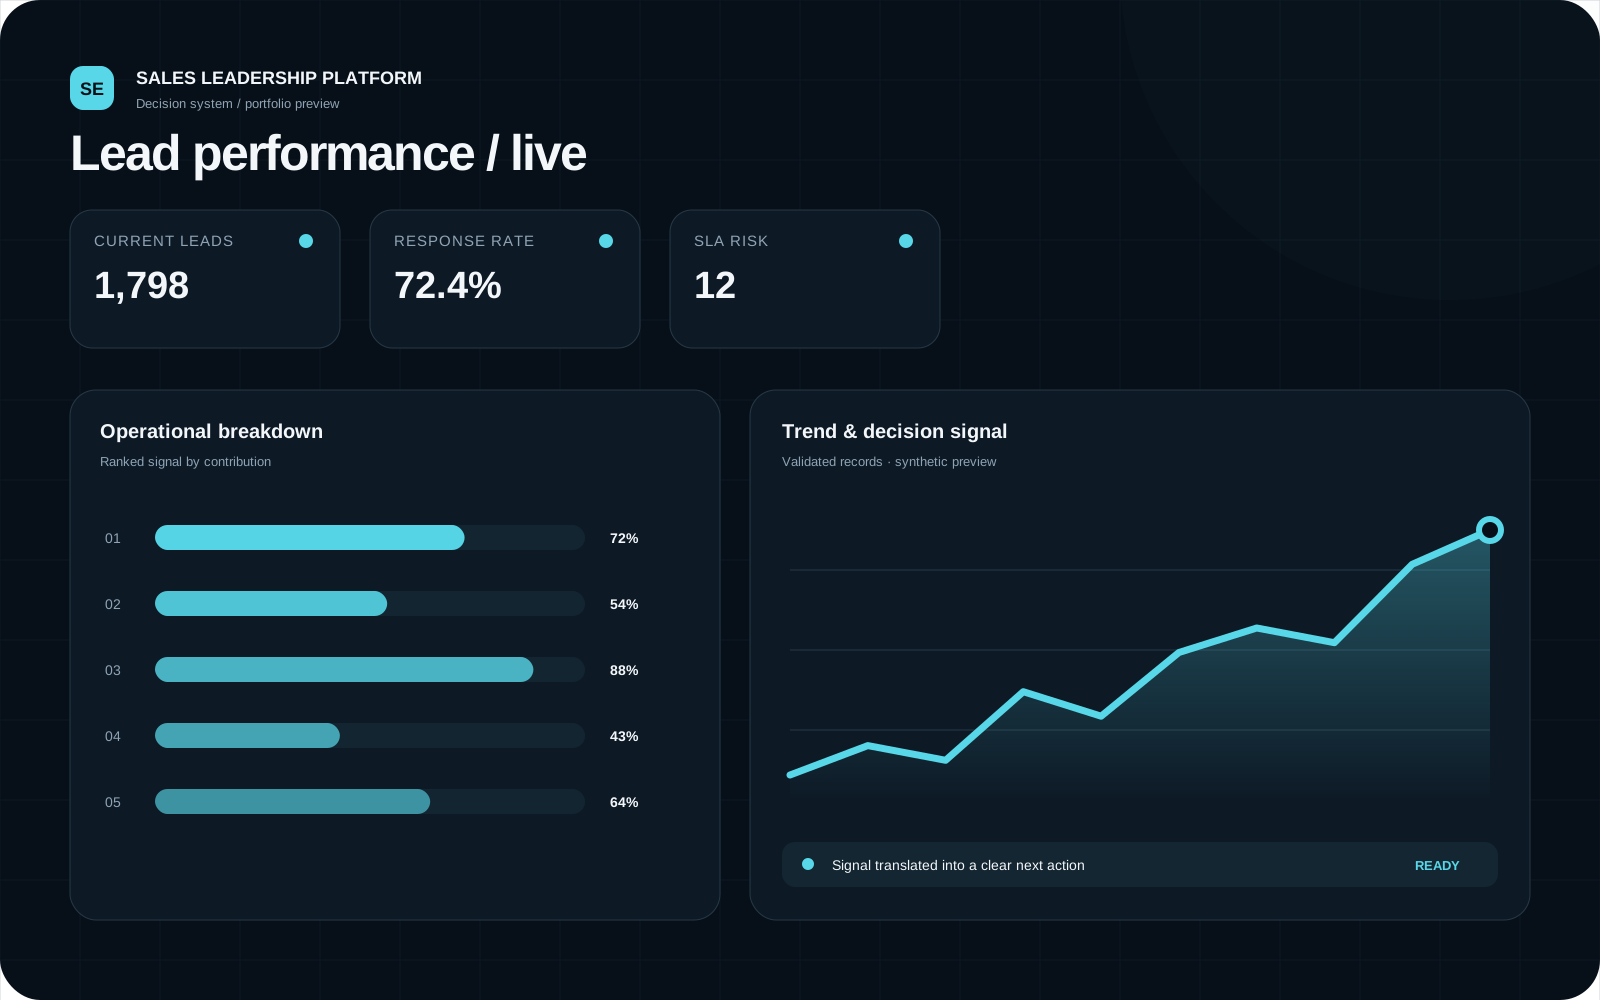
Two connected dashboard experiences for supervisors and sales leadership, built to monitor lead allocation, response quality, reassignment flow and SLA risk.
Why this matters
A production-style analytics product with secure access, live refresh, role-aware views, drilldowns and exportable operational evidence.
Business data shown in portfolio previews is anonymized, aggregated or replaced with synthetic demonstration data.
The question
Problem
Sales leaders needed one reliable view of current lead workload, feedback coverage, overdue activity, missed leads and reassignment patterns — while preserving each user's authorized scope.
The work
Approach
- 01
Normalized inconsistent names, IDs, dates, statuses and email fields before analysis.
- 02
Implemented credential-based access with admin, manager and supervisor scopes.
- 03
Used reactive polling to refresh source data without rebuilding the application.
- 04
Created executive KPI layers, advisor-level drilldowns and filtered CSV exports.
- 05
Separated operational supervisor views from cross-team leadership views.
Verified evidence
What the analysis surfaced
Access levels
Admin, manager and supervisor
Source refresh
Reactive polling with validation
Leadership KPIs
Leads, feedback, submissions, missed, reassigned and SLA risk
Decision exports
Filtered operational and risk records
The decision
Recommended action
- Use the overdue-risk view as the daily exception queue rather than reviewing every lead.
- Compare response and missed-lead rates together to avoid rewarding volume without follow-through.
- Keep role-level access rules in data configuration rather than hard-coding dashboard copies.
Capabilities demonstrated
Tools
Limits & responsible use
- Portfolio previews use anonymized, aggregated or synthetic demonstration data.
- Live applications may require credentials and can take time to wake on free hosting.