Insurance Analytics · R Shiny · Risk Monitoring
Medical Claims & Pre-authorization Intelligence
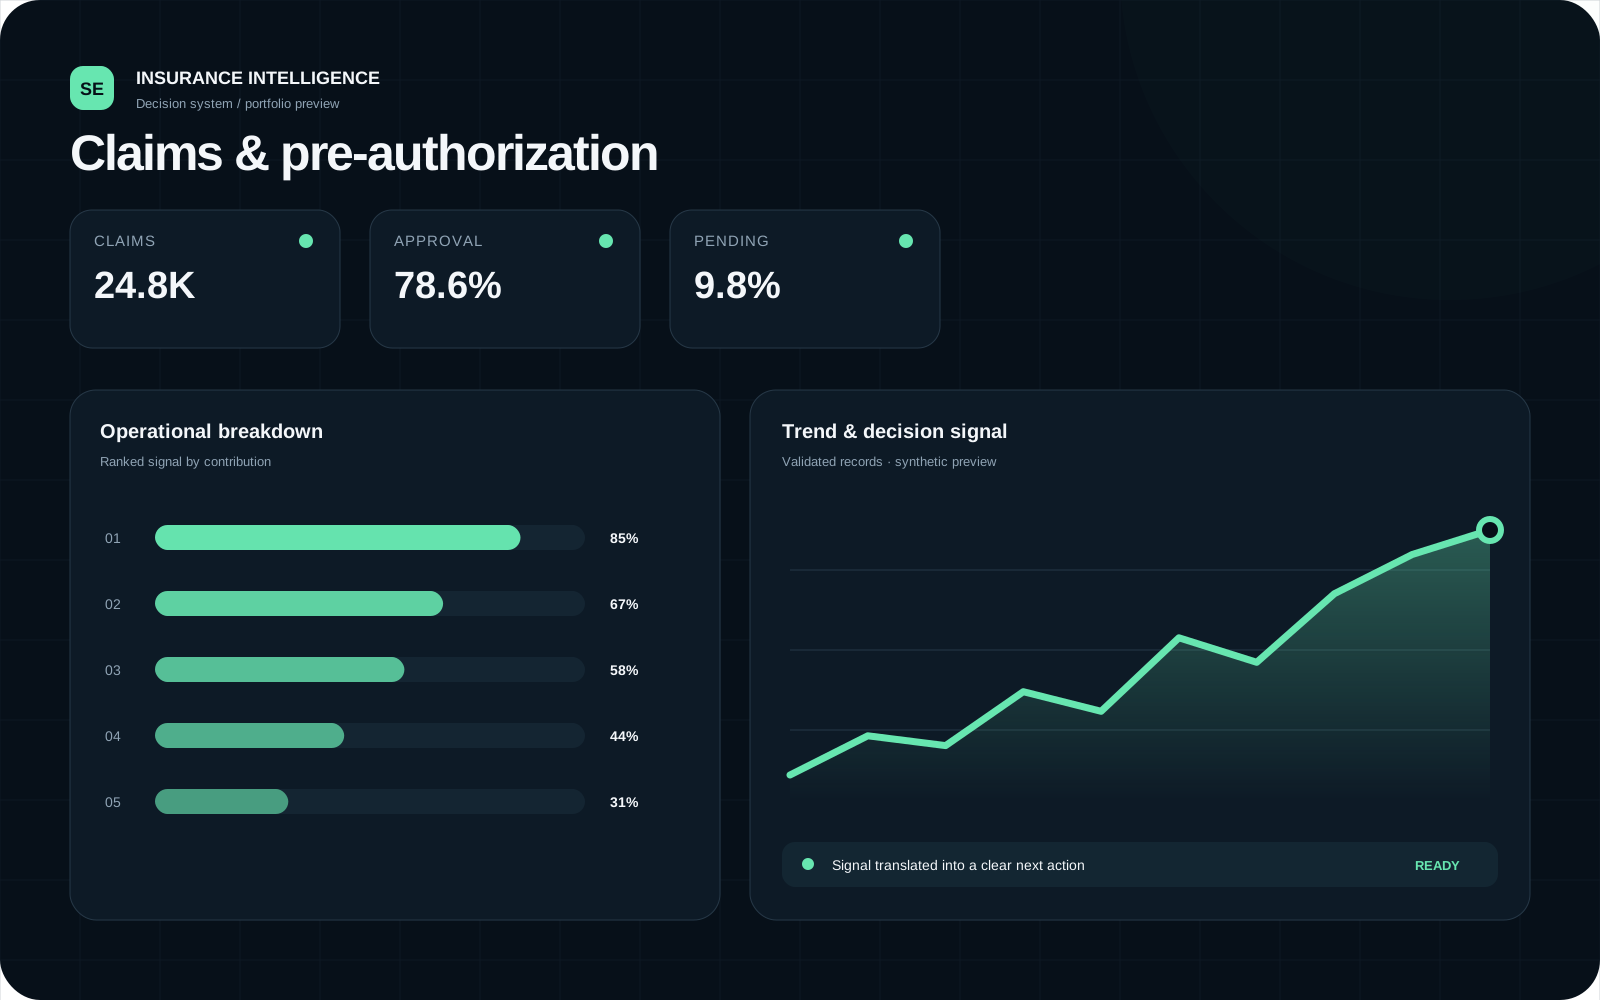
An interactive insurance dashboard connecting claims utilization, rejection risk and pre-authorization operations in one decision environment.
Why this matters
Moves users from total claims to risky insurers, rejection reasons, pending operations and row-level evidence without leaving the dashboard.
Business data shown in portfolio previews is anonymized, aggregated or replaced with synthetic demonstration data.
The question
Problem
Claims and pre-authorization records contained different operational signals. Stakeholders needed to understand utilization, approvals, rejection concentration, pending workload and provider risk in one place.
The work
Approach
- 01
Prepared reusable reimbursement and pre-authorization fact tables.
- 02
Built filters for dates, clients, insurers, service groups and statuses.
- 03
Designed risk rankings that combine rejection rate, volume and rejected amount.
- 04
Added Pareto analysis, rejection-reason decomposition and record-level exports.
- 05
Used interactive Plotly charts for monthly and daily operational patterns.
Verified evidence
What the analysis surfaced
Operational domains
Reimbursement and pre-authorization
Provider ranking
Insurer and TPA prioritization
Client concentration
Cumulative approved-value analysis
Record evidence
Filterable tables and CSV export
The decision
Recommended action
- Prioritize providers with both high rejection rates and meaningful volume.
- Review top rejection reasons by provider before launching broad process changes.
- Track pending rate alongside request volume to distinguish workload spikes from process delays.
Capabilities demonstrated
Tools
Limits & responsible use
- The portfolio does not expose confidential policyholder or client-level information.
- Business impact is presented as demonstrated capability unless a verified outcome is available.